This is the part 2 of the design phase. For people who haven’t seen the part 1, please have a look. This will help you integrate the whole design flow.
Design analysis and development
In a industrial work flow, there are couple of modules which are involved in a product/solution design. A complete design requires not only generating ideas but also verifying that idea as a workable solution. How do we evaluate if our idea works as we expected? You need to establish some sorts of experiments in which a clear analysis proves your point. Therefore, engineering statistics steps in into your experiments, which guides you what to do and how to analyze the results. A useful websites named Engineering statistics handbook offers a completely overview for the experimental problems your will encounter in the engineering field. These problems can be categorized into several modules which are exploration, measure, characterize… etc. If any of them fit your current problem, have a look in the details. When you look into each category, you will notice that the approaches used in different categories are very similar because they were originated from the fundamental statics methods, such as data exploration, regression, variance analysis and design of experiments, for which another online course website is recommended to guide you step by step on understanding these statistics methods. In this post I will focus pretty much on the usage of design of experiment and design for six sigma and how these methods are incorporated into the design flow.
Design of Experiments(DoE)
DoE is a quite powerful skills in the data analysis. The fundamental concept is to tune the input parameters in an organized sequence such that the effect of each parameters in a process/model is known. Once the effect of each parameters is identified, we can know which parameters give the most dominant effect and use the DoE model to search for an optimized design.
Think about our nice egg exercise. Assuming in the previous modeling exercise the recipe has been generated as the following:
- put an egg in 200 degC water for 10 minutes and cool down the egg in the room temp 25 degC for 5 minutes
- put the egg back to the 80 degC water for 5 minutes, then a soft-boiled egg is made.
Now you get a chance to test your recipe. What kind of experiments should I do? how to use the results to convince my stakeholders to accept this recipe? The experiments that you can run could have the following flow:
- Set up the objective of an experiment. In this case the objective is the temperature of the yolk. The yolk temperature should be well controlled such that it can still maintain liquid.
- Determine a sampling plan for the design parameters. There are five parameters in this recipe, the first water temperature, the cooking time, the first cooling time, the second water temperature and the cooking time. We should set up an experiment to vary each of them one by one in order to know their effects.
- Run the experiments and enter the result into the DoE software like Minitab or R to see what the effect of these parameters are.
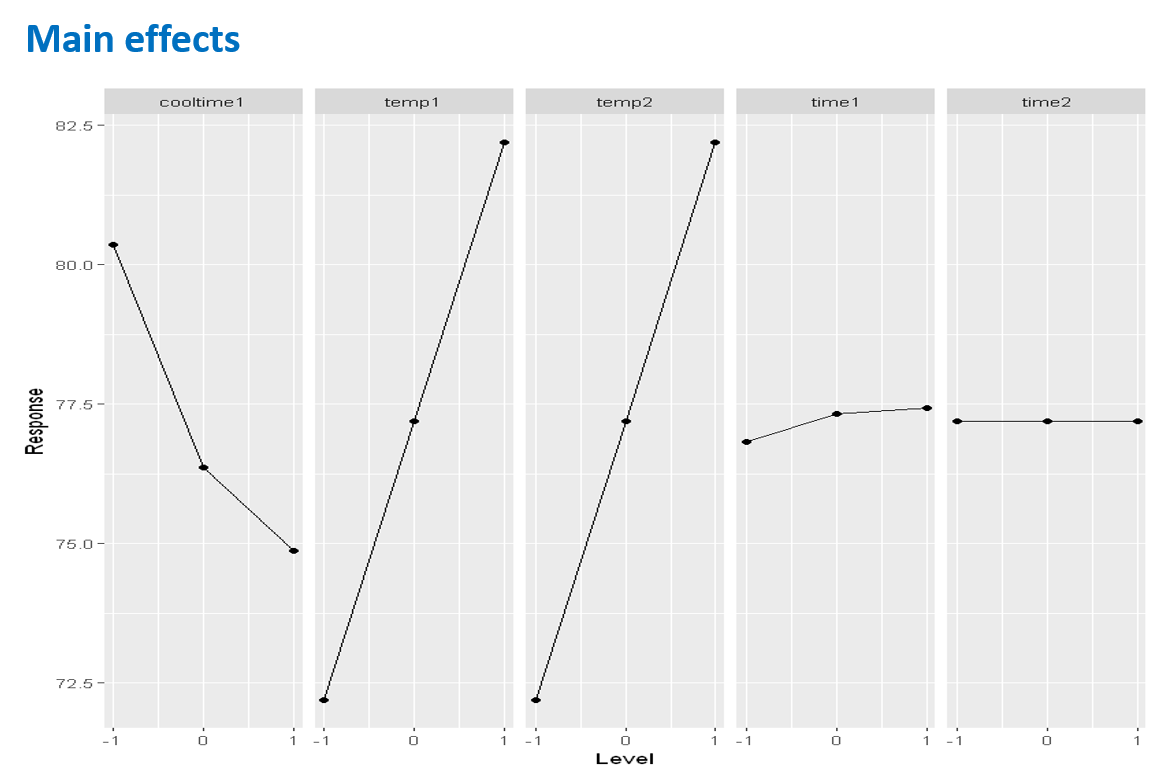
the expected outcome for this experiment would look like the following graph. We see that the most critical factors are the heating temperatures in those two steps. The cooling time has a non-linear effect to the final temperature. For the rest the impact is very limited. Therefore, you would need to well control these two factors, temp1 and temp2. The reason why multiple levels of a factor are taken into account is to cover the discrepancy of the simulation and the reality for these physical quantity and to understand the sensitivity of each factor.
Design for Six Sigma(DfSS)
DfSS is a training which helps you to be familiar with the other common static methods used in the design analysis. These tooling are linked to the problems, such as process capability and stability, measurement system evaluation, design of experiments and reliability. The DoE method has been covered in the previous section. This section I would like to explain how to incorporate process capability in the design analysis.
So far I believe you have been pretty familiar with the recipe of cooking soft-boiled eggs. You have a good understanding about the recipe both in simulation and in experiment. What is still missing in the last mile? You need to show this recipe is capable of being used in the production environment (other restaurant staff are capable of making a successful soft-boiled egg using this recipe). Therefore, the last experiment you will do is to ask your colleague to cook soft-boiled eggs with this recipe and calculate what the Cpk value is.
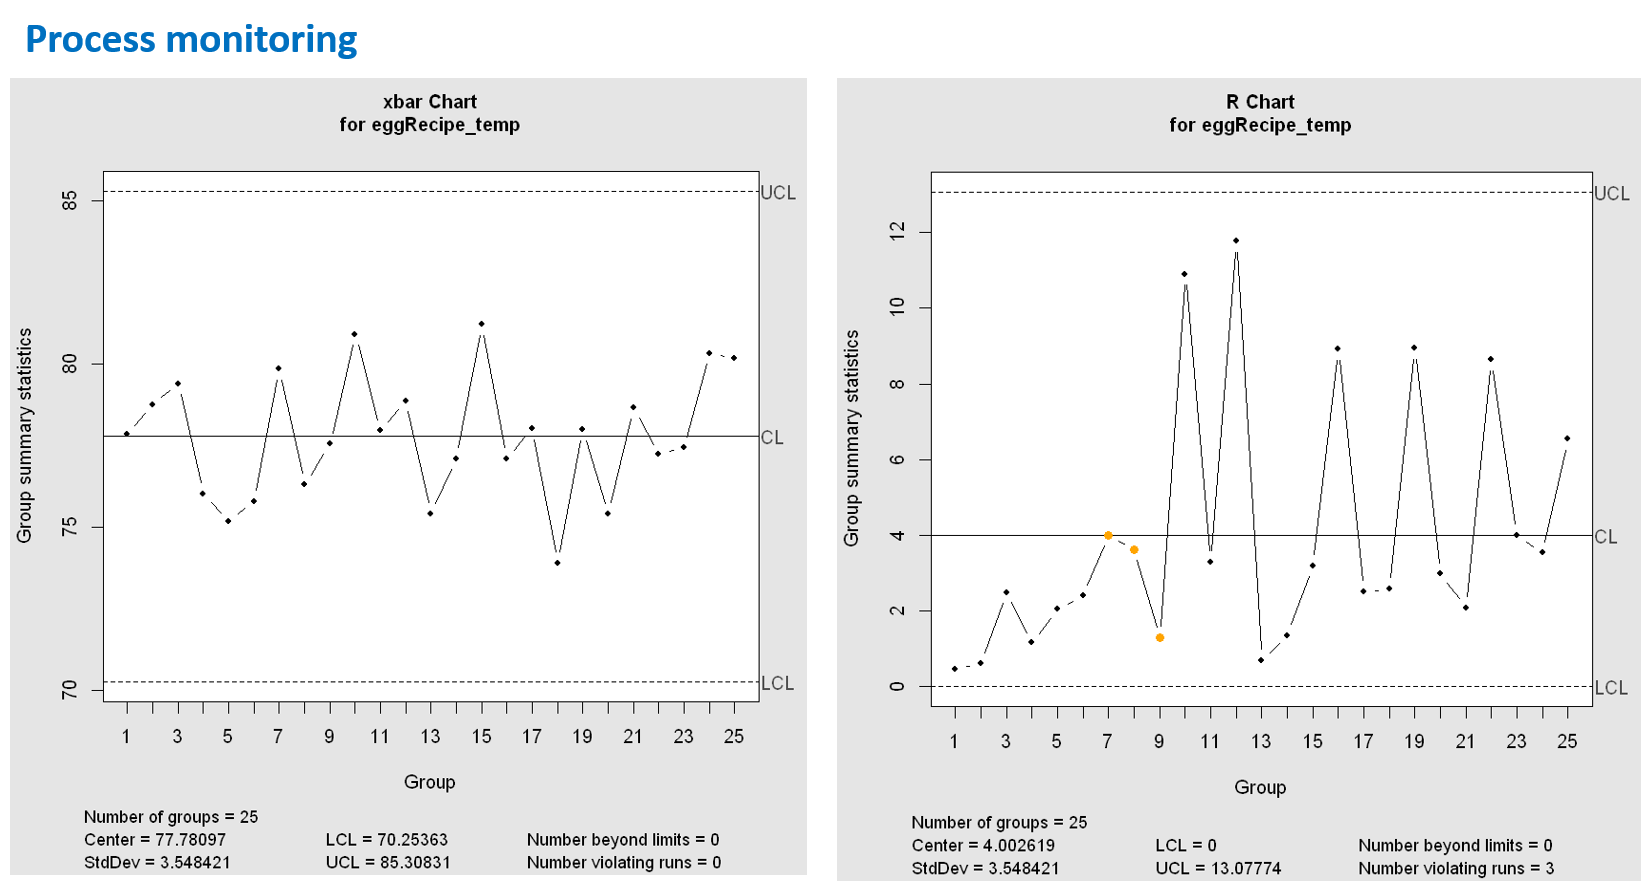
The experiment could be done in this way: 1) cook at least five eggs per day with your recipe and measure the yolk temperature. 2) keep doing this for consecutive 25 days. The data will be a 25 by 5 dataframe. You can use X chart and R chart to analyze the temperature mean and range variation during these 25 days. There are some rules that a stable process need to comply with in the control charts. In our test case, all the data are within the control limit, meaning that the data itself has no extreme outliers.
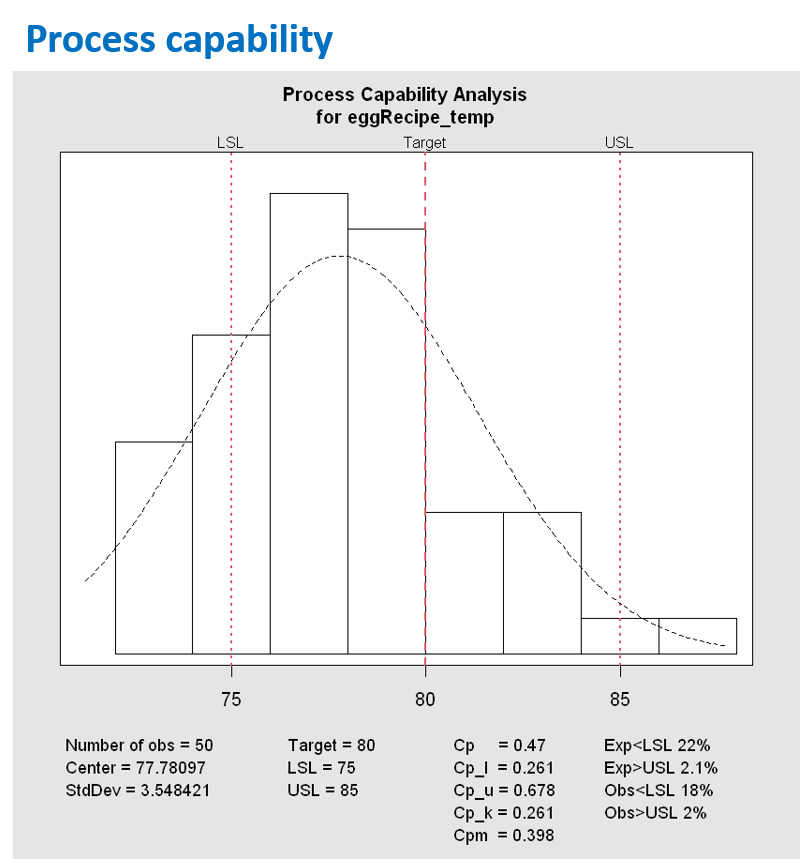
Since there is no strange data in our dataset, we can continue the process capability analysis. In the previous section, we said that a good soft boiled egg should have yolk temperature around 80 degC. This number is our target, and we can accept +/- 5 degC variation in our product. According to this specification and our data, our recipe has the Cpk value 0.26, which actually suggest that this recipe is not capable of making a successful soft boiled egg in the production (typically Cpk value should be greater than 1.33). The main problem indicated the capability is the offset of mean which makes the whole distribution shift towards the left. We should try to find in which recipe step there was an added heat source. Besides, the temperature and cool time control in the process can still be improved to reduce the temperature variation.
Summary
In this series I explained what the verification role of design analysis and development is in the design phase. Two useful statistic methods were introduced, DoE and DfSS, which help you to know how to incorporate them into the design analysis. Linking to the previous series, Modelling, DMD and DAD together are the miniature of the design workflow. Although I used a simple toy case to demonstrate these concepts, they are scalable to the industrial work with different domain contents included.